Your coding agent can check the page in your own Chrome
Codecast lets a coding agent open pages in the Chrome you already use, with your logins, in a background tab of its own. Its screenshots and the errors the page logged come back into the conversation, so you see what it saw without switching windows.
A check we ran today
On November 11 we started Claude Code in a terminal and typed one request: check that the pricing page renders on codecast.sh and on a local dev server, screenshot both, and report any console errors. Nothing else was typed into the session. Codecast showed the conversation as it ran, and this is the top of Claude's answer.
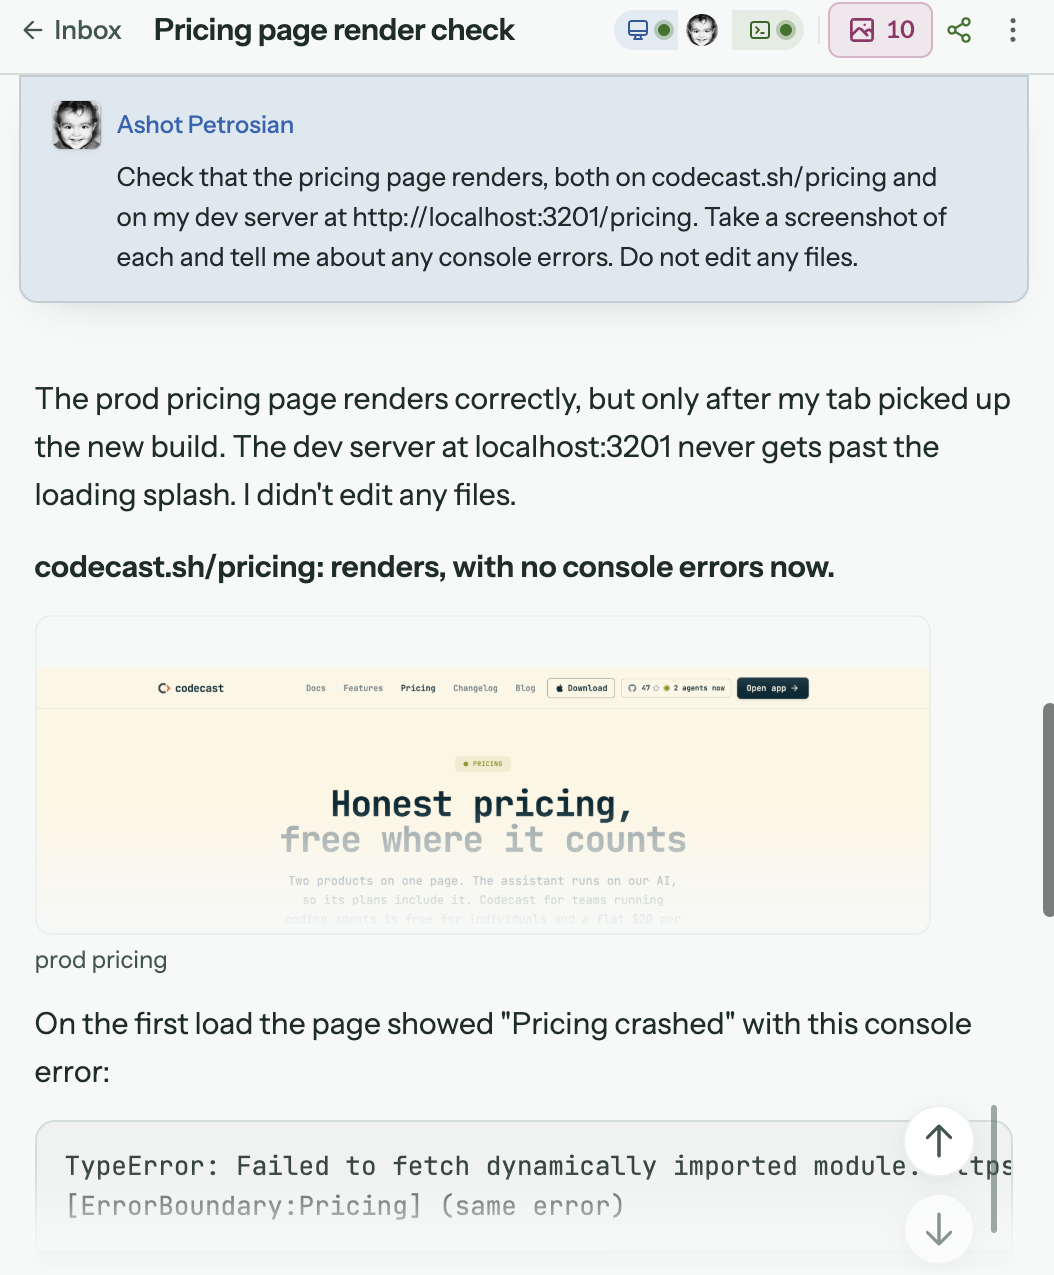
The first load of codecast.sh/pricing showed “Pricing crashed”. Claude read the console, found Failed to fetch dynamically imported module, and traced it to the site's service worker: that Chrome had an older build cached, and the old build asked for a file the server no longer has. Claude told the service worker to check for an update, reloaded, and the page rendered with no console errors. It also pointed out that anyone holding the same old build would see the crash until their service worker updates. That one is a real bug on our site, found by the check.
The dev server was stuck on its loading screen, with nothing in the console but Vite's connection messages. Claude asked the server for the app's main file directly, got an HTTP 500, and read the compile error behind it.
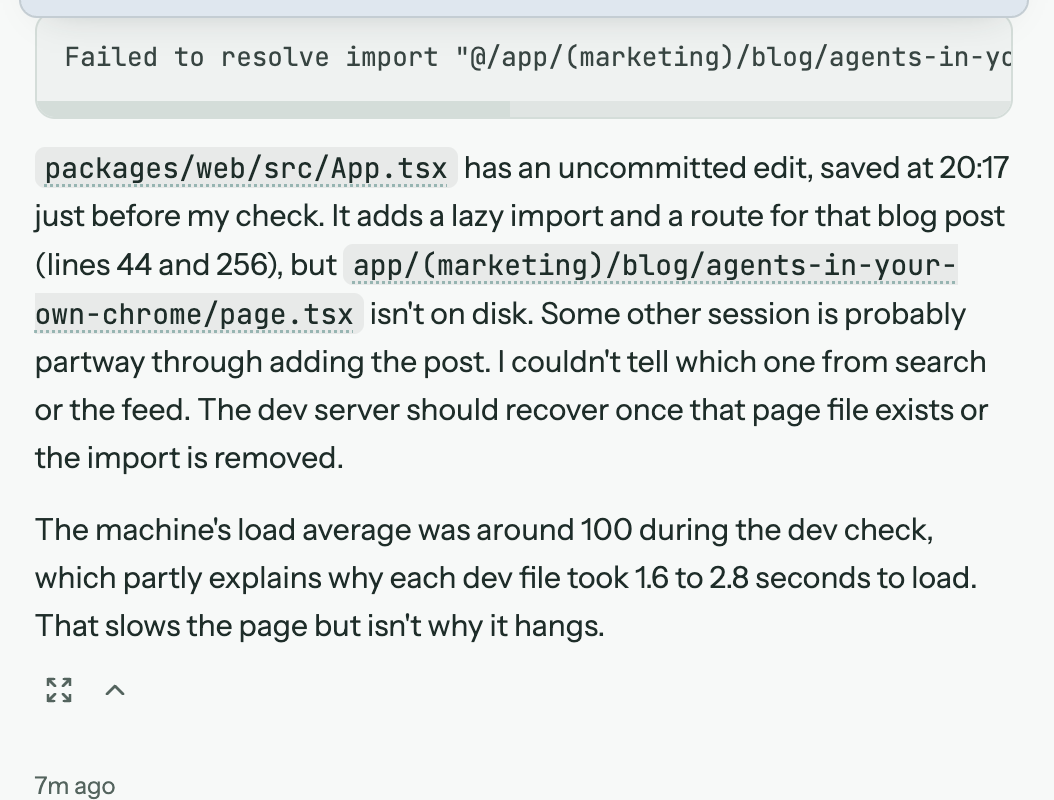
The missing file was this post. We had added its route a few minutes before writing the page, and the check caught it. We ran the same request again fifteen minutes later: both pages rendered, with no console errors.
Where the agent's tab lives
The agent works in the Chrome you already have open, in the profile you paired, so your logins come with it: staging, an admin panel, a dashboard behind single sign-on. Nothing is copied out of Chrome. Each session gets one tab, opened in the background inside a red tab group called Cast. It never takes focus, so you can keep typing in your own tabs while it works.
A tab being driven wears a thin frame and a pointer follows the agent's clicks. If you pin the Codecast icon in Chrome's toolbar, its badge reads RUN while you look at a tab an agent is driving. Chrome also shows its own notice that Codecast is debugging the browser. The frame and pointer are hidden while a screenshot is taken, so they never end up in the picture.
A session can only touch tabs it opened. It cannot read, close or navigate your tabs or another session's, and a tab you open yourself is moved out of the Cast group so agents leave it alone. When a session finishes, its tab is closed.
What comes back to the conversation
Each browser step shows up in the conversation as a row above the agent's reply, with thumbnails of the screenshots it took. Click a thumbnail to see it full size. open tab brings the agent's tab to the front in your Chrome, watch live opens it in a pane beside the conversation, and if the tab has been closed the row offers to reopen it. The count of images in the conversation header opens all of them in one viewer.
When a page misbehaves, the agent reports the errors the page logged and the requests that failed, as in the check above. You read the cause in the reply instead of opening DevTools yourself.
What you do once
Open Agent features from your account menu, pick the computer your agents run on, and switch on Browser under Hands on the machine. The card asks for two steps: Install extension adds Codecast from the Chrome Web Store, and Pair connects it to that computer. When both are done the card reads Chrome connected.
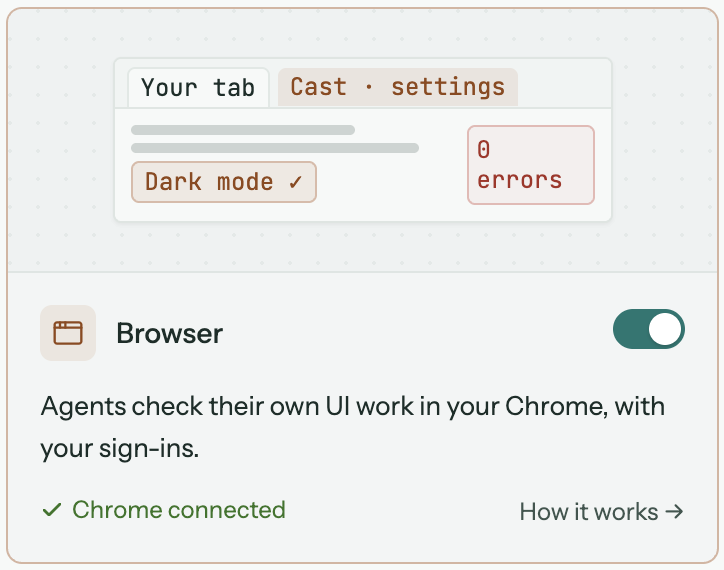
Chrome has to run on the same computer as the agent, so you repeat this on each computer you use. If an agent reaches for the browser before setup is done, the same steps appear as a card under its step in the conversation, with a button to tell the agent to continue once Chrome is connected.
Sign-ins and other steps that stay yours
When a page asks for a login, a two-factor code or a payment, the agent hands that step to you. A card appears inside the page in its tab saying what to do, with a Continue button, and the pinned icon's badge reads WAIT on that tab. You sign in, click Continue, and the agent carries on in the same tab. Only your own click counts; the agent cannot press Continue for you.
A few other limits are built in:
- If the extension is missing or asleep, the agent waits and tells you what to fix. It does not start a different browser instead.
- Chrome does not let any extension drive its own pages, such as
chrome://settings or the Chrome Web Store. The agent gives you the link and the steps and carries on with the rest. - Agents read and click through pages freely. Submitting a form, sending a message, buying something or changing account settings happens only when you asked for it.
- A project can list the sites its agents may visit. Local addresses like a dev server are reachable only when the list names them exactly.
What you need
Desktop Chrome, the Codecast app on the computer where your agents run, and the extension paired from Agent features. You don't need a team for any of it. Ask in plain words (“open the settings page and show me a screenshot”), and agents that change a web app also use it to check their own work. The browser guide has the full setup and a troubleshooting table.
For people who script: agents drive the tab with cast browser commands (open, shot, console, handoff), and you can run them yourself from a terminal.
Codecast records every coding agent session you run, on any machine, and gives you one place to see them, steer them and answer them, on your own or with your team.
All three screenshots are the Codecast web app in Chrome on 2026-11-11, signed in to the founder's account, from a local build of the app. The first two are crops of one conversation, a Claude Code session started in a terminal with the request shown; its findings are quoted as it wrote them. The third is the Browser card on the Agent features page. Each image is cropped to the conversation or the card, leaving out the sidebars and other sessions. Nothing was composited or retouched.